
Introducción
Quantifying movement velocity is the only way to control intensity and level of effort at the gym. Each velocity is hugely correlated with a percent of the repetition maximum (%RM) (1). Moreover, by monitoring velocity loss during the series you can control the level of effort and fatigue levels during the series (2). Thus, monitoring movement velocity will help you to adjust your training based on your daily status, estimating 1RM daily to know the exact load to put at the bar and settings velocity cut-offs to perform the exact reps you need to achieve your aims.
Spleeft is an app available both for iOS and Android that helps you to measure barbell velocity in real-time without any external devices, just with your phone’s camera, thanks to Computer Vision technology.
This article aims to present you the results of a little validation study where movement velocity measured with Spleeft was compared with the same data measured with a scientifically validated linear transducer (LT) (3).
As an advance, its validity and reliability were confirmed, as it was found a very high correlation coefficient (r2>0.95) at both devices, and no significant differences were found between Spleeft and the LT (p>0.05).
MÉTODO
A subject performed 106 squat reps. (taking advantage of the stretch-shortening cycle) with a constant load of 20kg, changing the intention to perform the squats with a velocity between 0.39–0.81 m/s.
Spleeft app was installed on an Android smartphone (v1.4.1) Xiaomi Redmi Note 6 Pro with Android 9, which achieve a mean latency of 18fps with a camera preview size of 240×160 in accurate mode, and an Apple iPhone 7 (v1.0) with iOS 15.0, which achieve a mean latency of 24fps with a standard HD resolution of 720p. A scientifically validated LT (3) was used as the gold standard to measure mean concentric velocity.
RESULTADOS
Concurrent validity of the app
A very high correlation was found at mean velocity values measured with Spleeft and the LT, both on iOS (r2=0.98, SEE=0.01 m/s, mean error = 0.025 m/s) and Android (r2=0.96, SEE=0.01 m/s, mean error = 0.029 m/s).

Fiabilidad y precisión de las mediciones de la app frente al LT
The paired samples t-test showed that there are no significant differences between the app and the LT (p>0.05).
Bland-Altman plots revealed a little systematic error on both devices (r2=0.35 in iOS y r2=0.25 in Android). However, if we perform the same calculations taking into account just the time component, that is the value that Spleeft measures, as the ROM must be introduced by the user, the systematic error was minimum (r2=0.096 in iOS y r2=0.046 in Android).
The explanation of that fact is so easy, because the systematic error was due to the ROM variation with the velocity increase, as he got his heels off the ground at the fastest squats. The mean ROM measured with the LT was 48.28 cm ± 1cm, while the movement velocity was measured with Spleeft with a constant ROM of 47 cm. At the squats performed between 0.6–0.69 m/s, the average ROM measured by the LT was 48.25 cm and between 0.7–0.81 m/s was 49.14 cm.
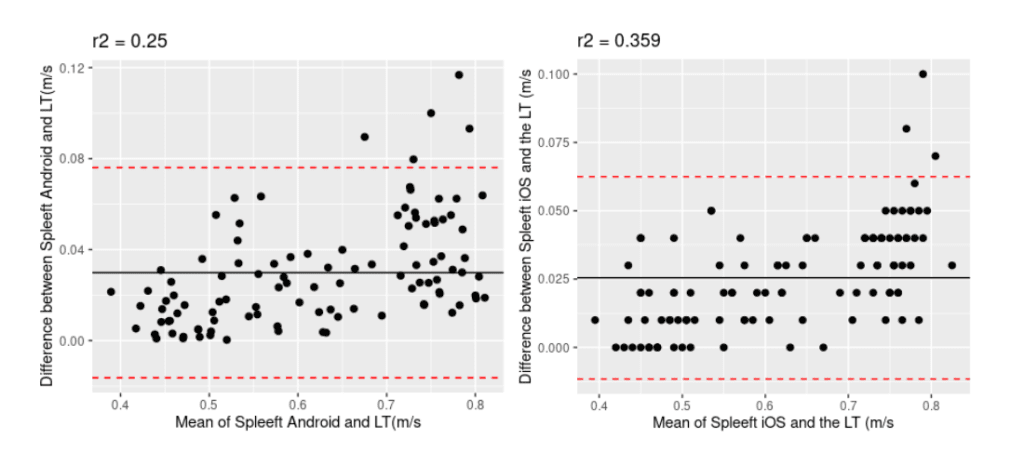
Bland-Altman plots are made with the difference between two values to compare and its mean. A high r2 correlation (<0.9) means that there is a systematic error.
Fiabilidad entre observadores
The intraclass correlation coefficient (ICC) revealed a high agreement between all the observers: Spleeft for iOS and Android and the LT (ICC=0.989, CI [95%]=0.974–0.995) at mean concentric velocity measurements. No significant differences were found between Spleeft on the iOS version and the Android version (p>0.05). The Bland-Altman plot confirmed the previous results (r2=0.09).
CONCLUSIONES
Spleeft reliability at both platforms is even higher than at the preliminary validation study performed at the last Android launch, as the mean error is minimum at all tested velocity ranges from 0.01 m/s between 0.39–0.49 m/s until 0.037 m/s of mean error between 0.7–0.81 m/s.
This app is also valid to estimate 1RM through the load-velocity profile (4), as its reliability to measure movement velocity has been probed, as long as the ROM remains constant.
A variation in the ROM of ± 2cm approx. don’t produce significant errors at the mean velocity measurement, despite that variation was found in ROM measurement with the LT, the correlation was very high and no significant differences were found at mean concentric velocity measured with Spleeft and the LT.
It should be noted how these data were measured by Spleeft running at low-mid range smartphones so that it’s not necessarily for a top smartphone to get accurate data.
Finally, it was found that Spleeft is a valid and reliable app to measure mean concentric velocity compared with a scientifically validated linear transducer, as long as the ROM remains constant.
REFERENCES
1. González-Badillo JJ, Sánchez-Medina L. Movement velocity as a measure of loading intensity in resistance training. International journal of sports medicine. 2010;31(5):347–52.
2. Sánchez-Medina L, González-Badillo JJ. Velocity loss as an indicator of neuromuscular fatigue during resistance training. Medicine and science in sports and exercise. 2011; 43(9):1725–34. ¡
3. Pérez-Castilla A, Piepoli A, Delgado-García G, Garrido-Blanca G, García-Ramos A. Reliability and concurrent validity of seven commercially available devices for the assessment of movement velocity at different intensities during the bench press. Journal of Strength and Conditioning Research. 2019;33(5):1258–65.
4. Jidovtseff B, Harris N, Crielaard J, Cronin J. Using the load-velocity relationship for 1RM prediction. Journal of strength and conditioning research. 2011;25(1):267–70.