Welcome to the Spleeft App, your personal assistant for tracking and improving your strength and power through velocity based training (VBT). Whether you’re a beginner or an experienced lifter, Spleeft offers real-time analytics, helping you optimize your training by focusing on barbell velocity and jump height. By simply using your phone or Apple Watch, the app delivers feedback instantly, enabling you to monitor key metrics like velocity and power during every workout.
In this step-by-step guide, we will walk you through how to set up and use Spleeft on both mobile and Apple Watch. The aim is to ensure you understand the basic functionalities, so you can get the most out of your training sessions.
DOWNLOAD SPLEEFT APP NOW FOR iOS, ANDROID AND APPLE WATCH!
What You’ll Learn:
Stay tuned for the first steps on setting up your account and linking your device to get started with velocity based training!
How to Measure Your Exercise Velocity in Velocity Based Training
Velocity Based Training (VBT) relies on measuring the concentric velocity of your lifts (the lifting phase of the movement). With the Spleeft app, you can do this easily using just your phone or Apple Watch. Here’s how to measure the velocity of your exercises and adjust your training based on the results.
A.) Phone
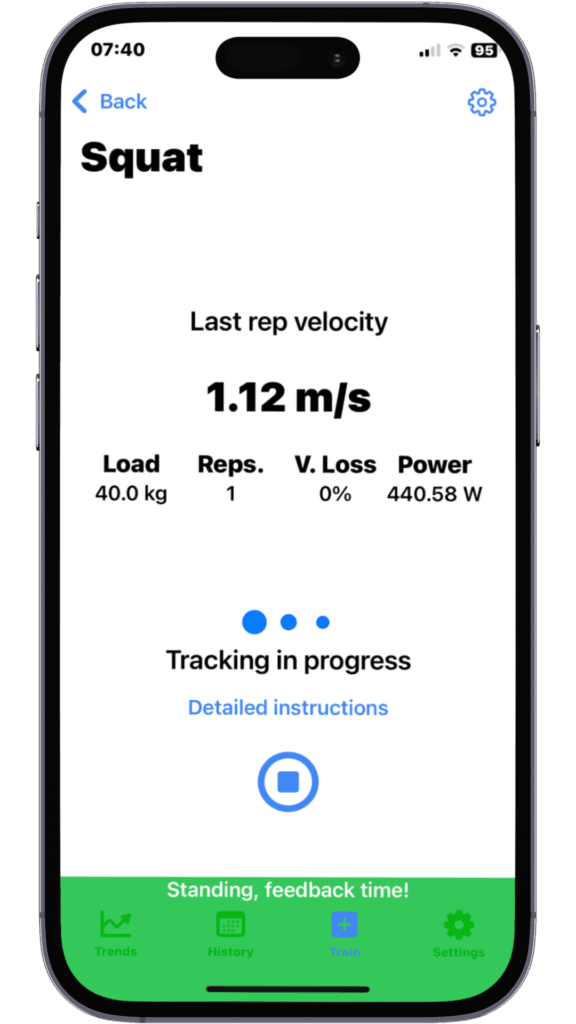
1. Start Your Training Session
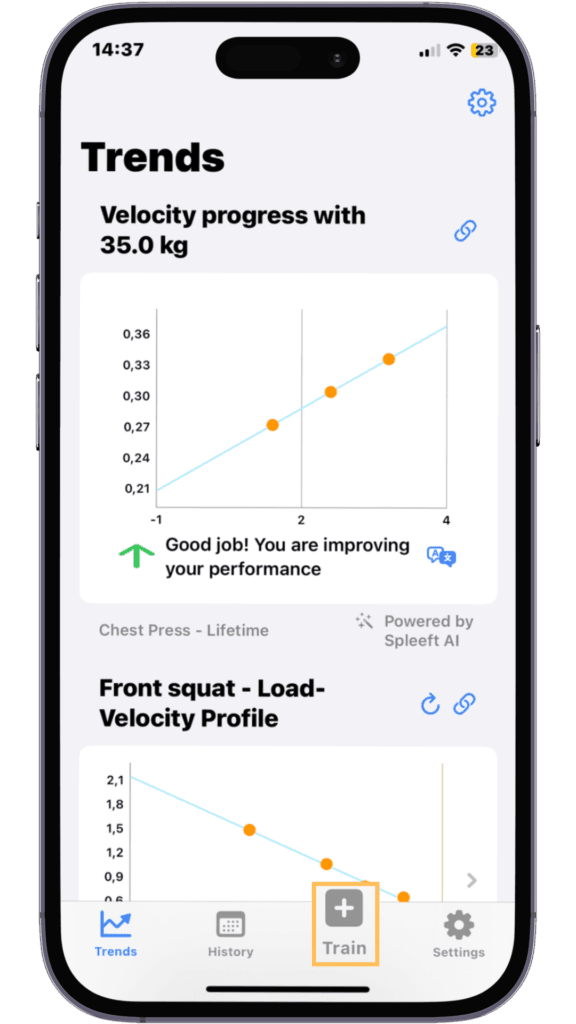
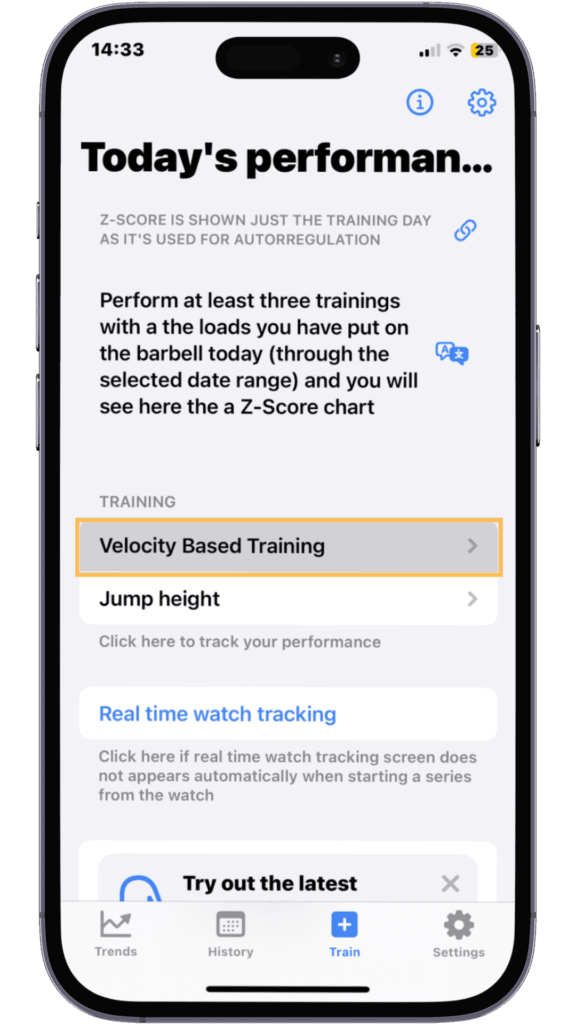
To begin measuring your training, simply open the Spleeft app and go to the “Train” menu. From there, select “Velocity Based Training.”
2. Set Up Your Training Parameters
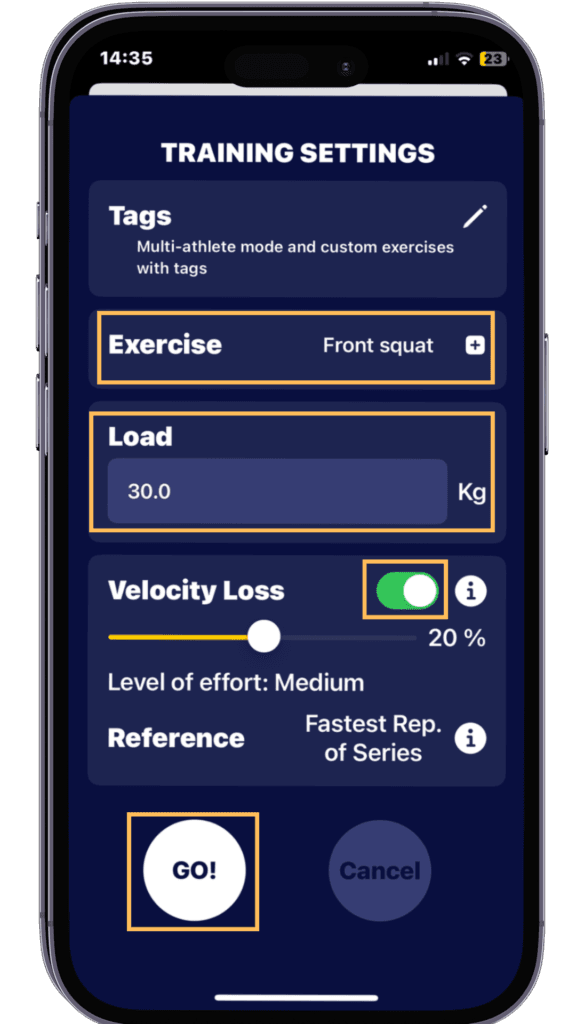
Once the training settings open, you will have several options to configure your session. Here’s what to do:
- Select your exercise: Choose the exercise you are about to perform.
- Set the load: Input the weight you will be lifting during the session.
- Activate velocity loss indicator: If you want to be alerted when your velocity drops by a set percentage, make sure to activate this feature.
3. Place Your Mobile and Start Training
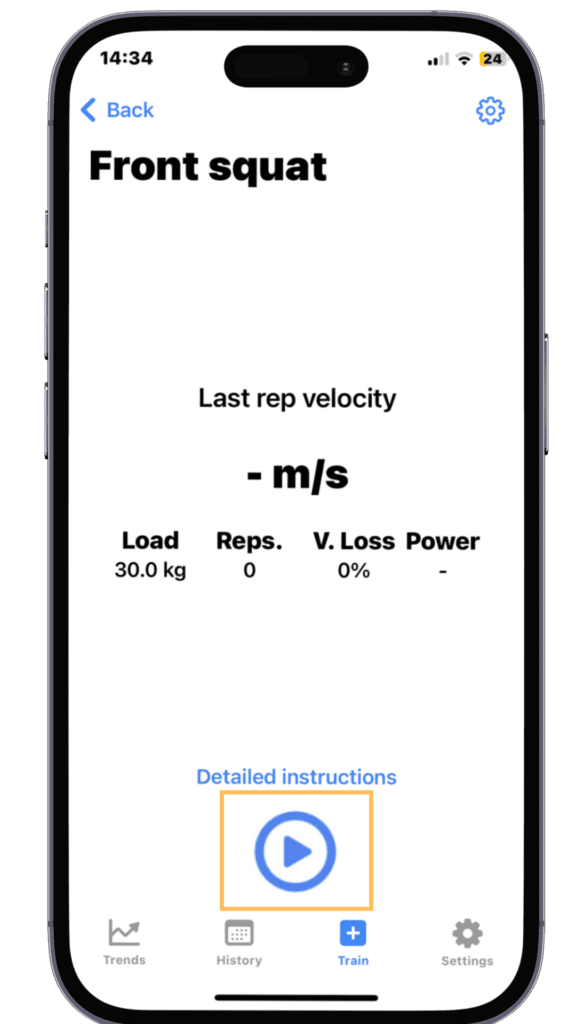
Position your mobile device in a stable place where it can clearly capture your movement. You can use your phone and place it on the machines on the plates only or attach it somewhere with the bar holder. You can also attach it to your barbell exercises with the same holder.
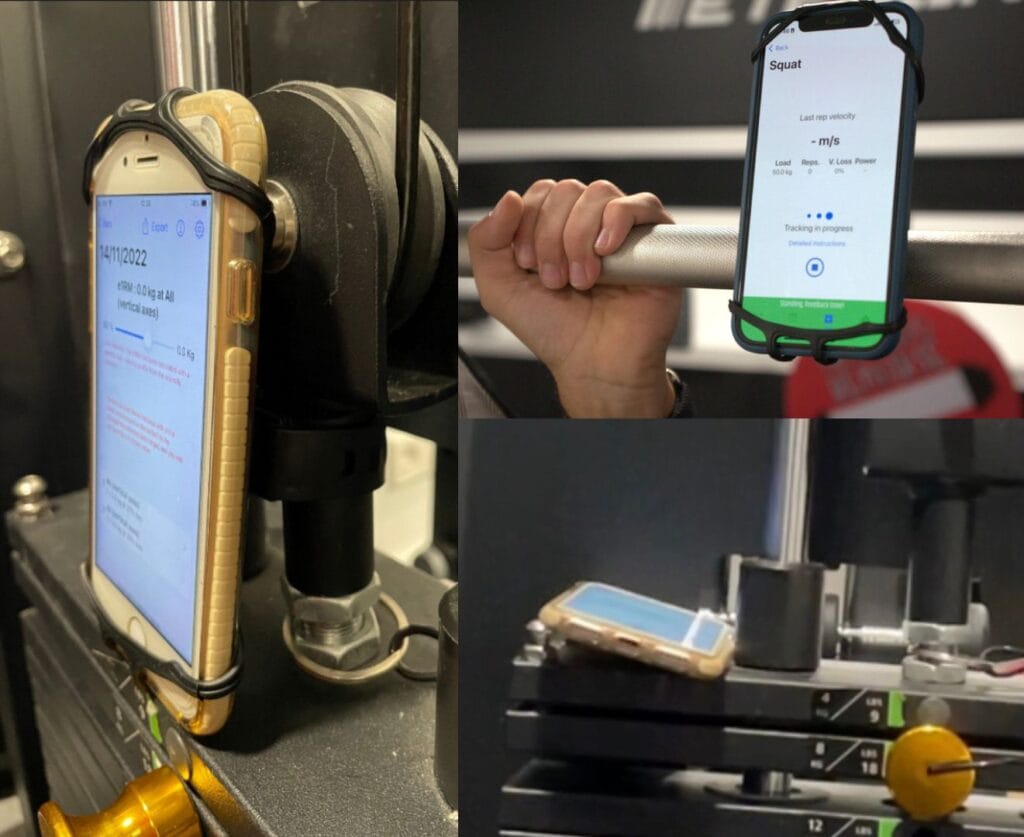
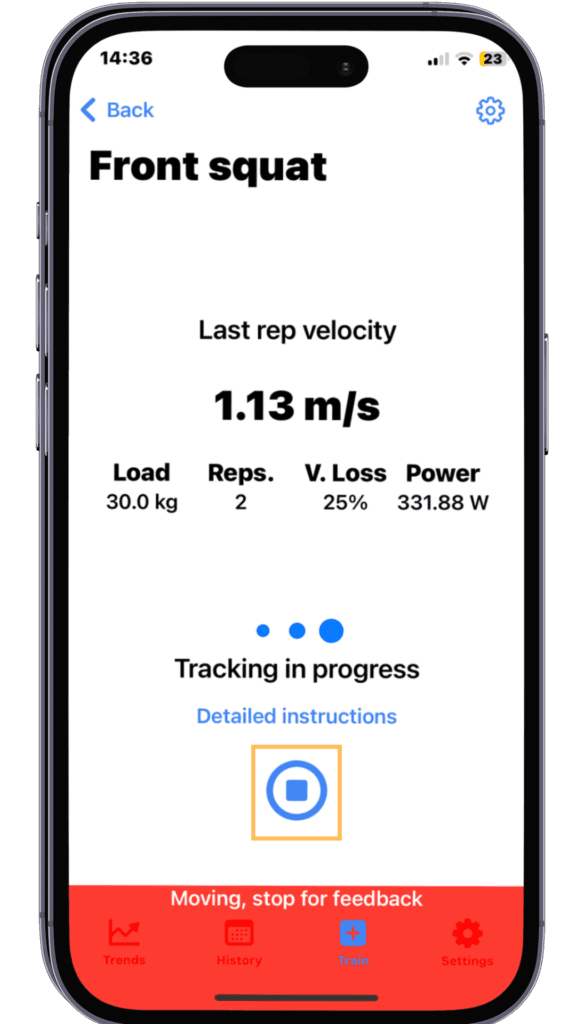
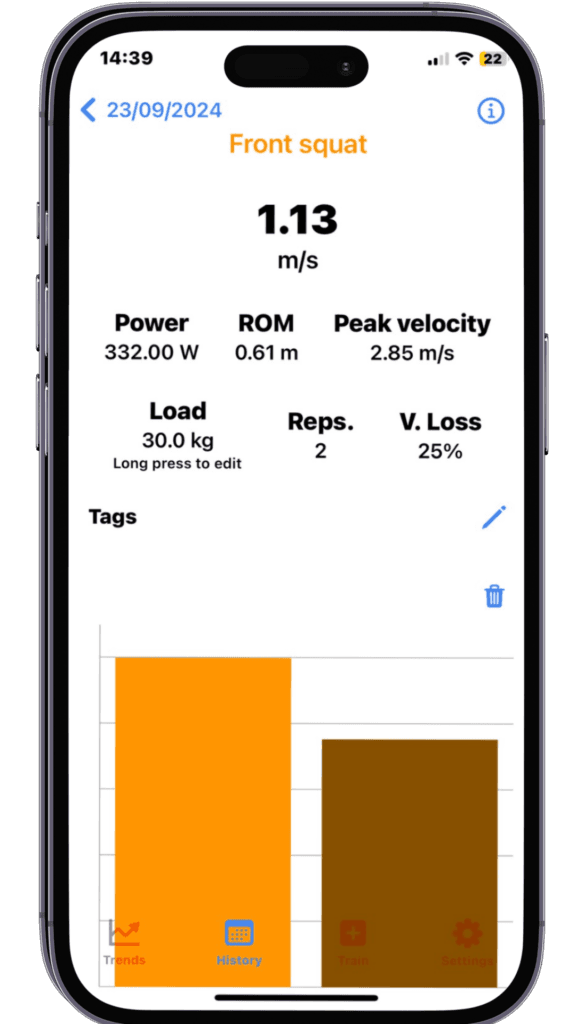
Once ready, begin your training. When you complete a set, pause the training and your data will be saved automatically in the Spleeft app.
Spleeft is not as fast as other devices in giving you feedback. It needs the user to make a pause between reps to calibrate the signal and give you the most accurate values.
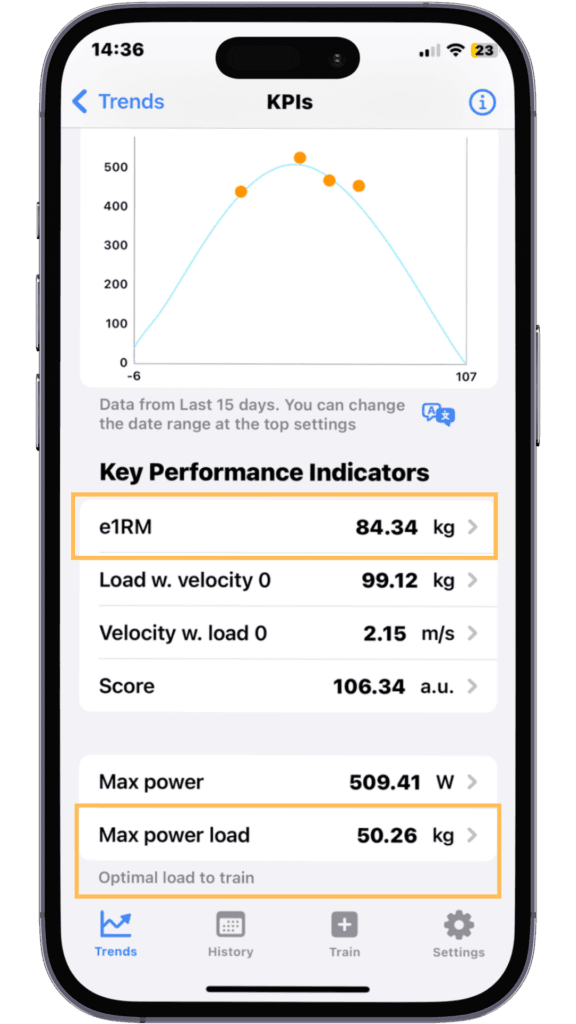
4. Analyze Your Load-Velocity Profile
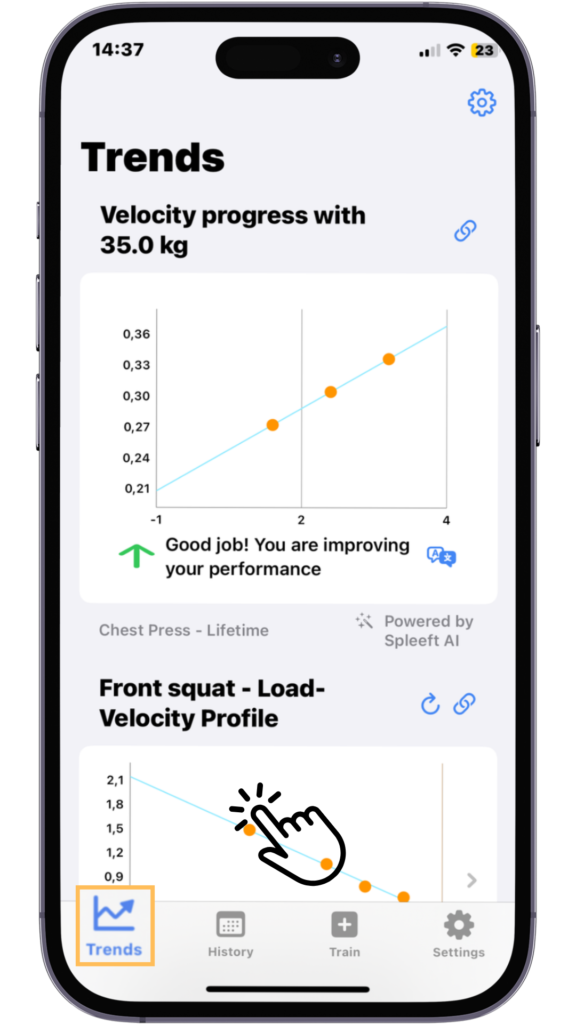
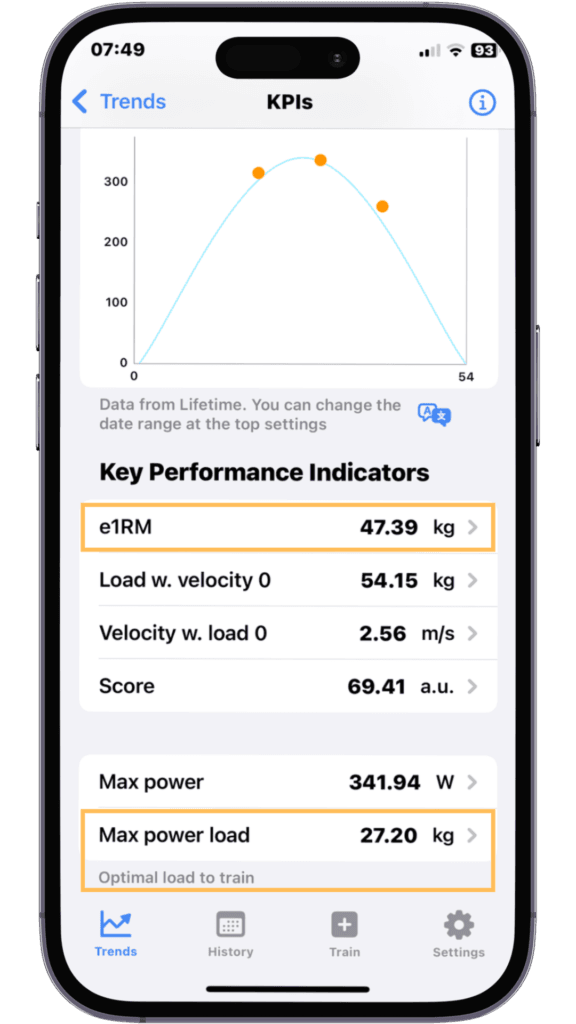
After your session, head to the “Trends” menu and select the “Load-Velocity Profile” option. A detailed menu will open where you can:
- View your 1RM estimation.
- Check the load at which you generate maximum power.
- Explore other detailed performance data.
Pro Tip: To get an accurate load-velocity profile, make sure to lift 3-4 different weights as fast as possible.
B.) Apple Watch
1. Start Your Training Session
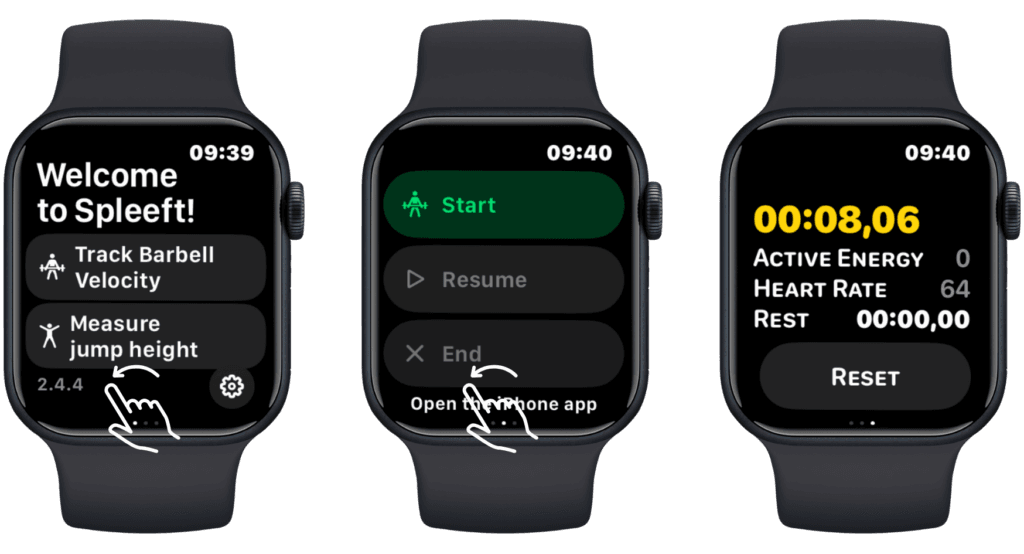
To start your training session using the Apple Watch, open Apple Fitness and swipe once to select “Start.” If you swipe a second time, you’ll be able to see different metrics that will be tracked during your session.
A training session is mandatory from Apple to record velocity data.
2. Select Barbell Velocity Tracking
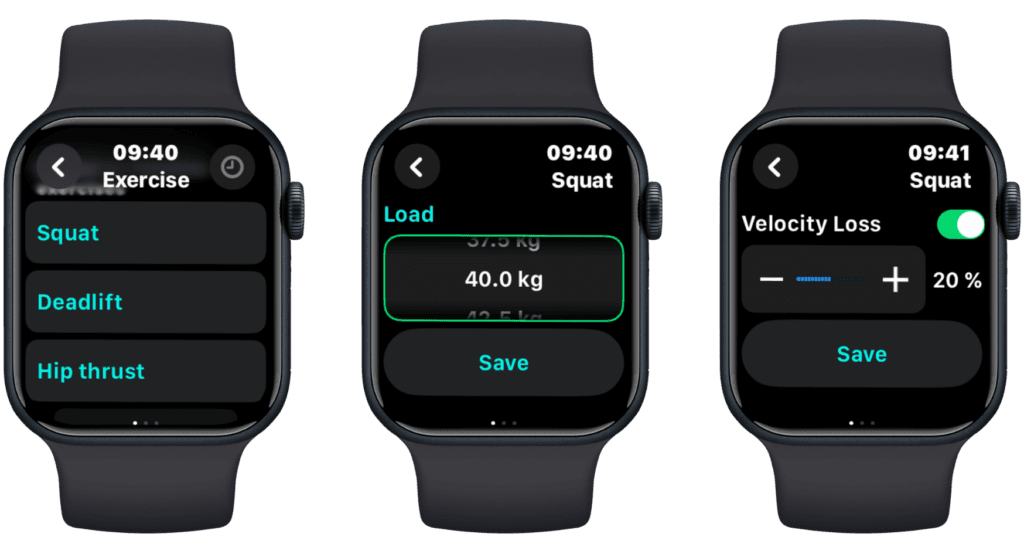
Now that the training has started, select “Track Barbell Velocity” on the main screen of the Spleeft Watch app. Then:
- Choose your exercise: Select the specific exercise you’re about to perform.
- Set the load: Input the weight you are going to lift.
- Activate the velocity loss indicator: If you want to measure velocity loss, set the percentage at which you want to be alerted.
3. Begin Your Training
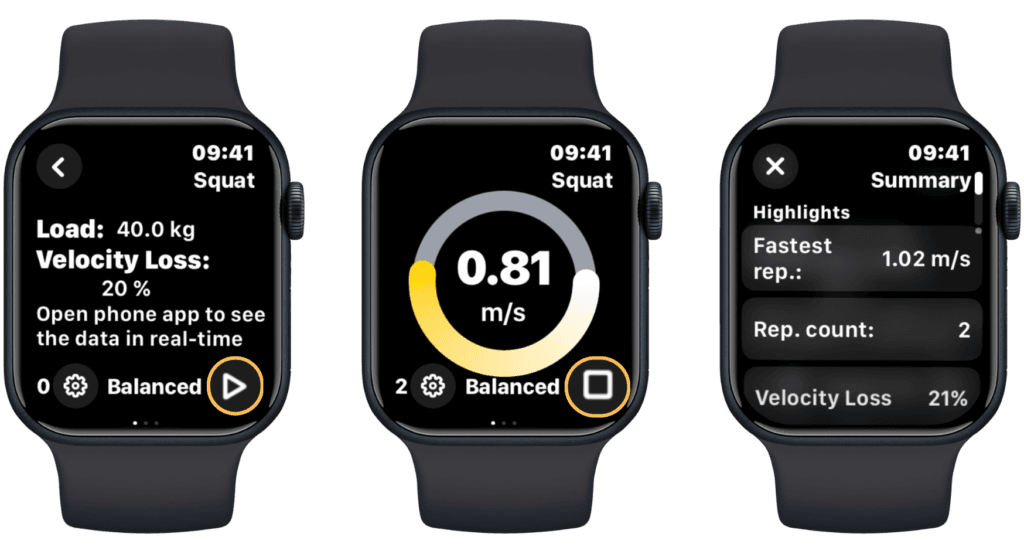
Once everything is set, press Play to start your session. Spleeft Watch will measure the velocity of each repetition directly on your watch. When you finish, just stop the measurement, and you’ll have access to multiple menus to review your performance by swiping from bottom to top.
PRO Tip: in order to get the most from your Apple Watch data, Spleeft offers three performance modes:
- Boost feedback mode: set by default, to offer you the values as soon as possible. However, this mode is just recommended for high cadence movements.
- Balanced mode: our traditional mode offers you accurate values as you can read in our white paper. The feedback is slower than in boost feedback.
- Accurate mode: in Apple Watch 8 and newer we offer this mode with 200 Hz measurements for testing. It is slower than the balanced mode and more accurate just for high-velocity movements.
4. Review Your Training Data
At the end of your session, you can review your training history immediately on your iPhone or by going to the “Exercise” menu in the top right corner of your watch. Here, you’ll be able to:
- View detailed data for each exercise.
- Send the data to your iPhone’s Spleeft app if it hasn’t synced automatically.
Once you finish your training routine, stop the session, and you’ll have the complete results of your workout.
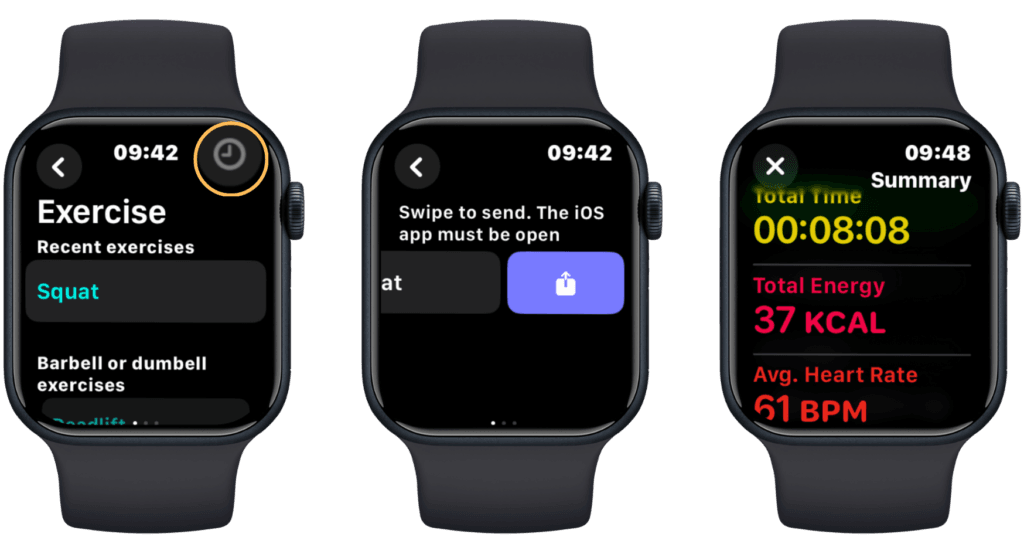
If you need even more instructions on how to use Spleeft on mobile or Apple Watch we leave you this video guide:
How to Calculate Your Jump Height with Spleeft
In addition to measuring exercise velocity, Spleeft allows you to measure your jump height, which is particularly useful for athletes aiming to improve vertical jump and explosiveness.
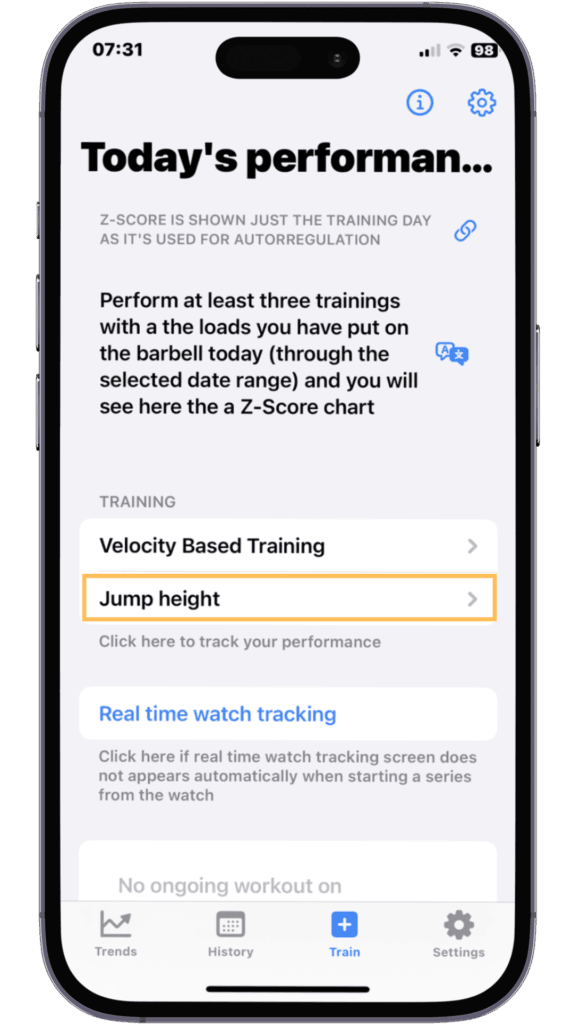
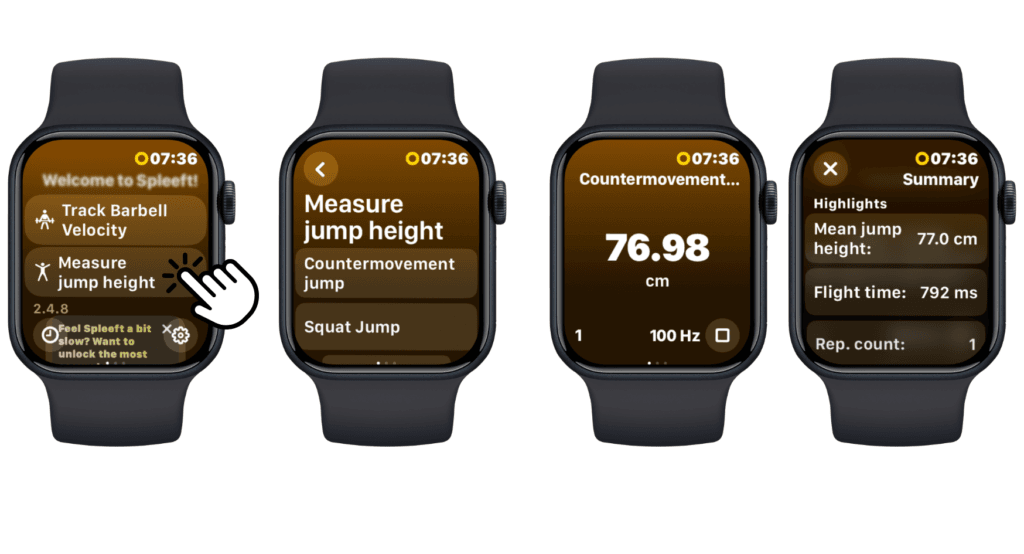
1. Set Up the App for Jump Measurement
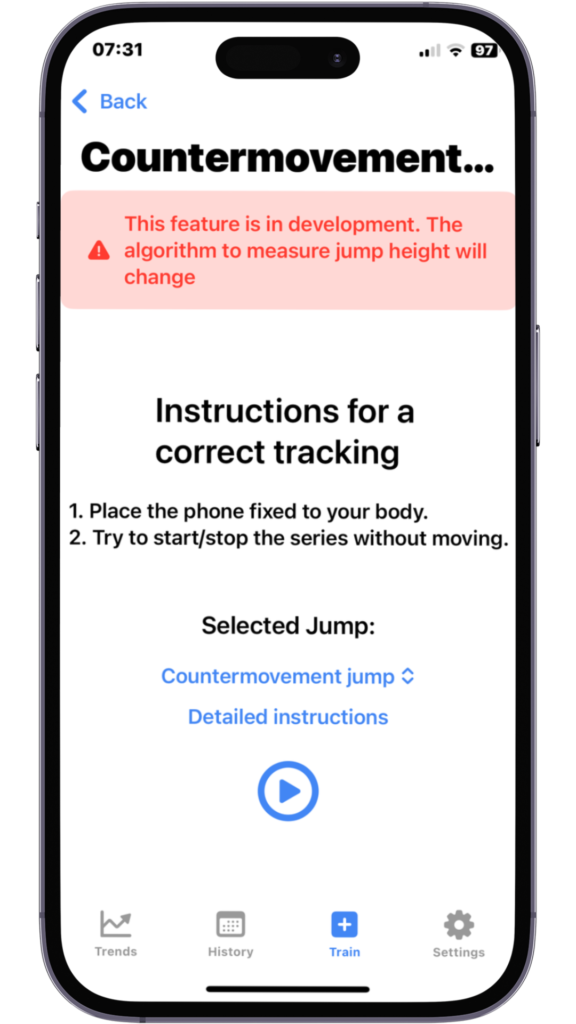
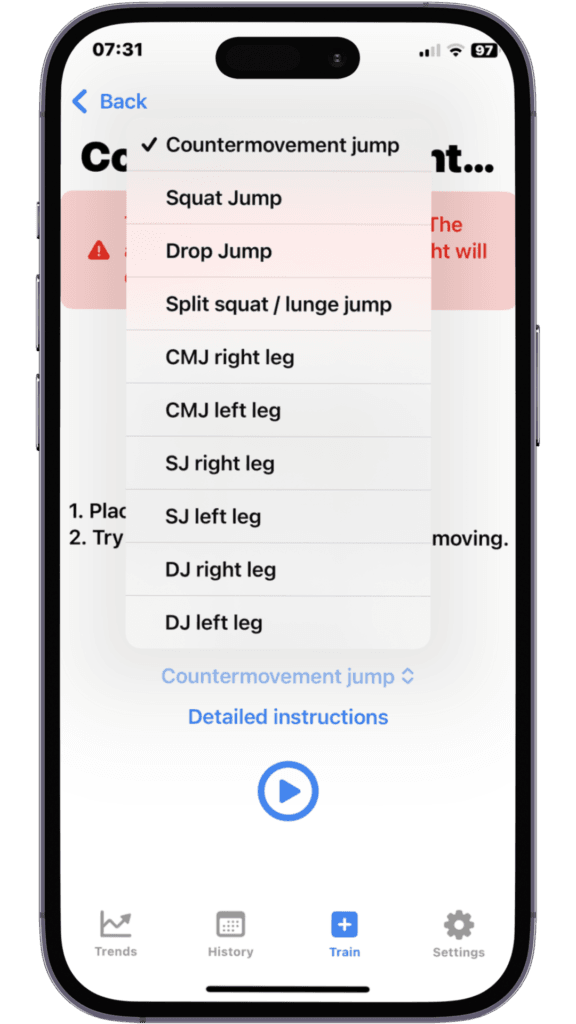
To measure your jump height, open Spleeft and select the jump training option. If you’re using an iPhone, make sure it’s placed in a stable position where it can capture your movement during the jump. If you’re using an Apple Watch, secure it properly on your wrist so the sensors can track your jump.
2. Perform Your Jumps
Perform one or several vertical jumps, aiming to jump as high as possible. The app will automatically begin measuring from the moment you leave the ground and will record the flight time—the time you spend in the air. The longer the flight time, the higher the jump.
3. Jump Height Calculation
Spleeft uses the flight time to calculate your jump height using the following formula:
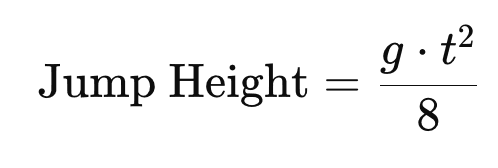
Where:
- g is the acceleration due to gravity (9.81 m/s²).
- t is the flight time (in seconds).
The app automatically performs this calculation and displays your jump height in meters or centimeters.
4. Review Your Results
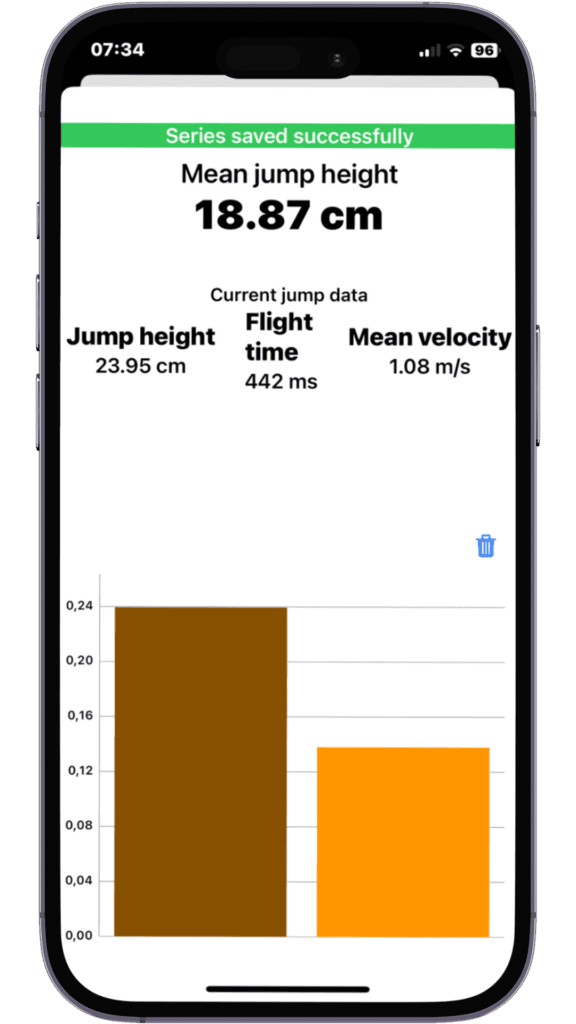
After completing your jumps, Spleeft will display the height of each jump as well as the average height across all jumps. Additionally, you can view metrics such as flight time and initial take-off velocity, which help you better understand your explosive power.
5. Use Your Results to Improve
If you measure your jumps regularly, you’ll be able to track improvements in your explosive power and make adjustments in your training to improve your jump height over time.

How to Calculate Your 1RM & Optimal Load
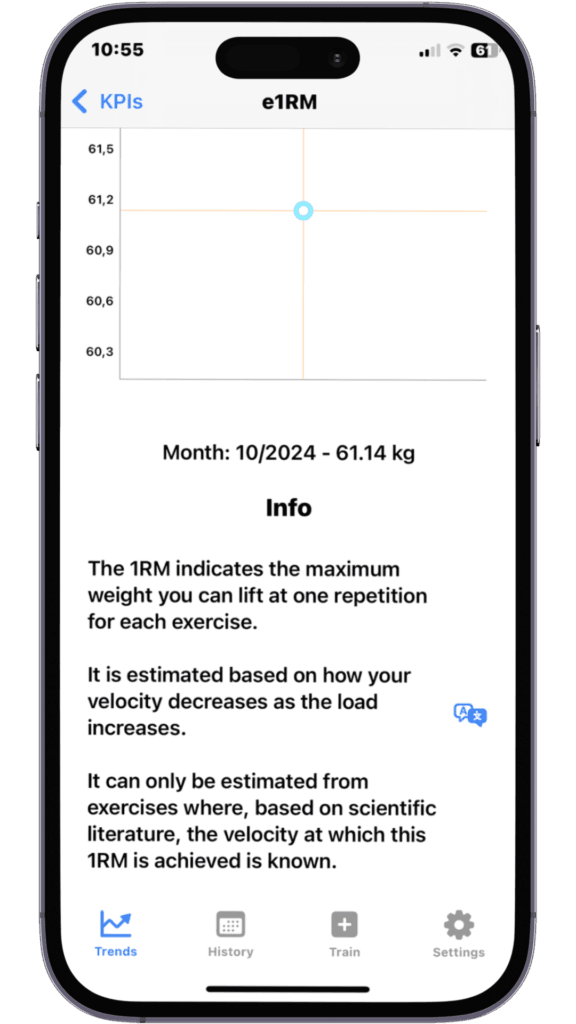
Calculating your 1RM (one-rep max) is essential for adjusting the loads in your strength training. Traditionally, this was done by lifting the maximum weight possible for one rep, but with Spleeft, you can estimate your 1RM more safely using the load-velocity profile.
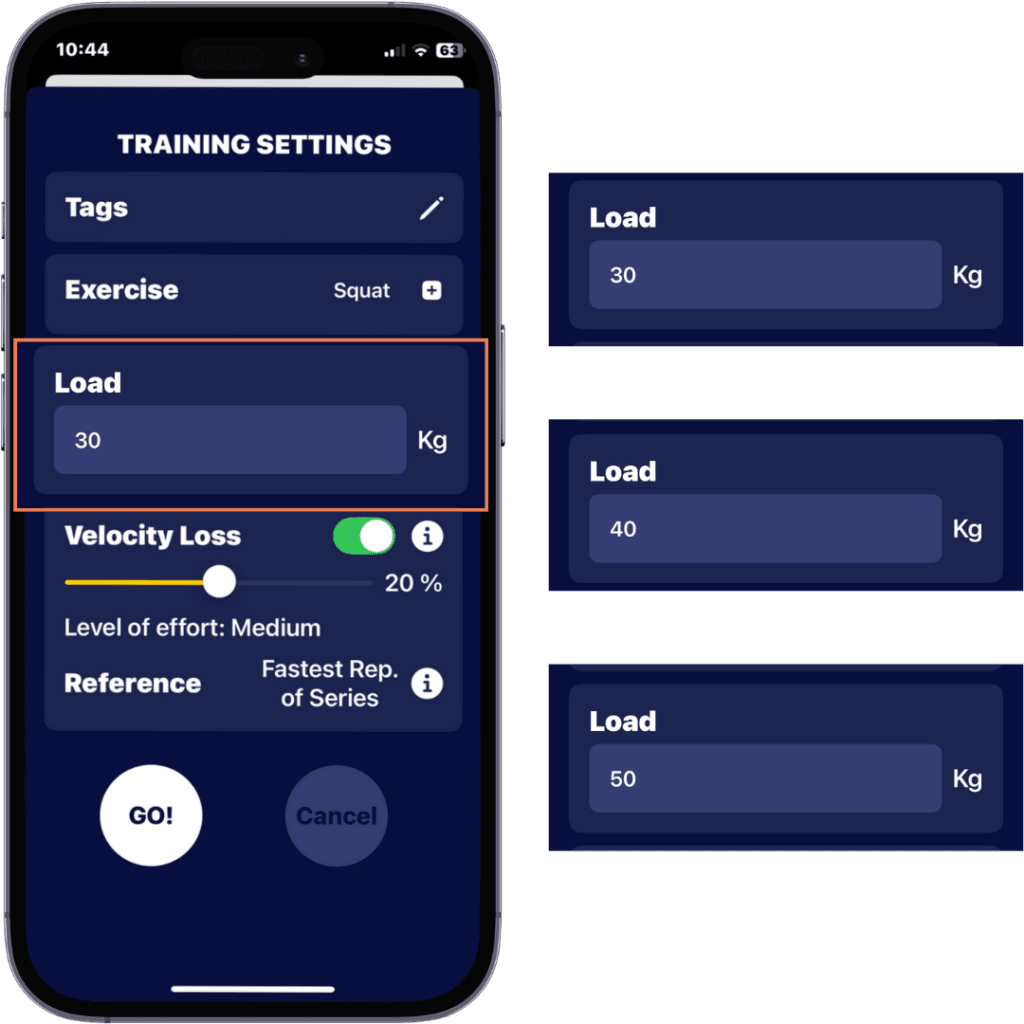
1. Perform Multiple Sets with Different Loads
Choose an exercise (such as squats, bench press, or deadlifts) and perform several sets using different weights. Make sure to use at least 3 or 4 different loads that range from light to heavy. The more varied your weights, the more accurate your 1RM and optimal load estimation will be.
2. Record the Velocity of Each Rep
Spleeft will measure the fastest velocity for each rep. It’s important to lift each weight as quickly as possible for the most accurate calculation. The app will record the velocity in meters per second (m/s) for each load lifted.
3. Create Your Load-Velocity Profile
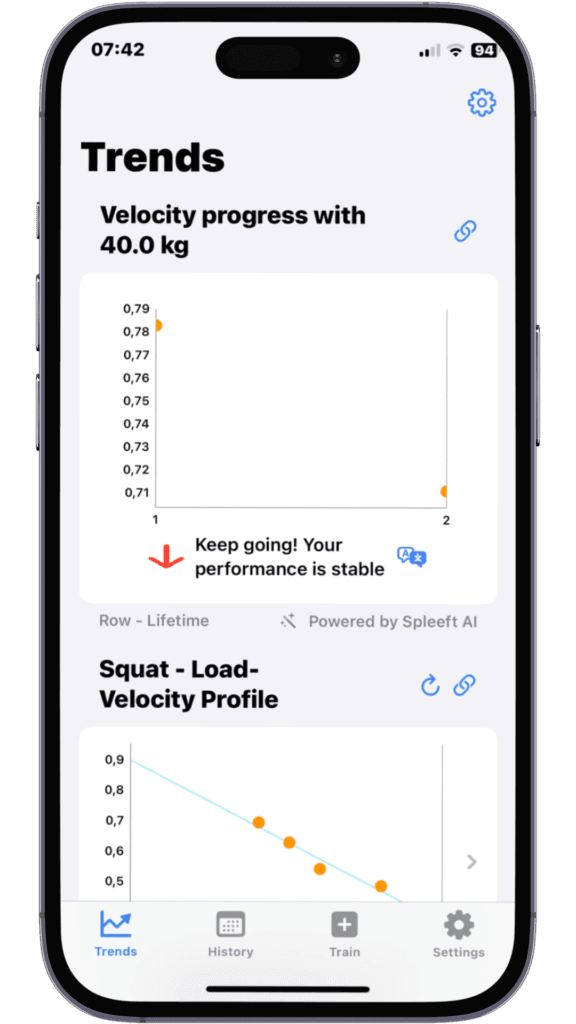
The app will generate a graph showing how velocity decreases as load increases. This inverse relationship helps you visualize your load-velocity profile, which Spleeft uses to estimate your 1RM.
4. Perform Linear Regression
Spleeft calculates a linear regression between the loads used and the fastest velocities recorded for each rep. From this data, a line is drawn that will help estimate your 1RM.
5. Estimate Your 1RM
Each exercise has a minimum velocity at which your 1RM is reached. For example:
- Squats: 0.32 m/s.
- Deadlifts: 0.14 m/s.
- Bench Press: 0.18 m/s.
Spleeft will extrapolate the data to calculate the maximum weight you could lift in one repetition when you reach that minimum velocity. This estimated value is your 1RM for that exercise.
Practical Example:
Let’s say you performed squats with the following data:
| Load (kg) | Velocity (m/s) |
|---|---|
| 40 kg | 0.80 |
| 60 kg | 0.65 |
| 80 kg | 0.50 |
| 100 kg | 0.35 |
Using this data, Spleeft will calculate a linear regression to determine the relationship between the load and velocity.
- 1RM Calculation: Based on the regression, Spleeft estimates that the load at which your velocity reaches 0.32 m/s (the critical velocity for squats) is your 1RM. In this case, it might estimate that your 1RM is 105 kg.
- Optimal Training Load: Additionally, Spleeft calculates that you generate maximum power when lifting around 60 kg, which is roughly 50-60% of your 1RM. This would be your optimal load for power training.

If you need even more instructions we leave you this video guide:
How to Interpret Graphs in Spleeft
The graphs in Spleeft are a crucial tool for understanding your performance and tracking how it evolves over time. These graphs provide clear insights into your progress and help you adjust your training effectively.
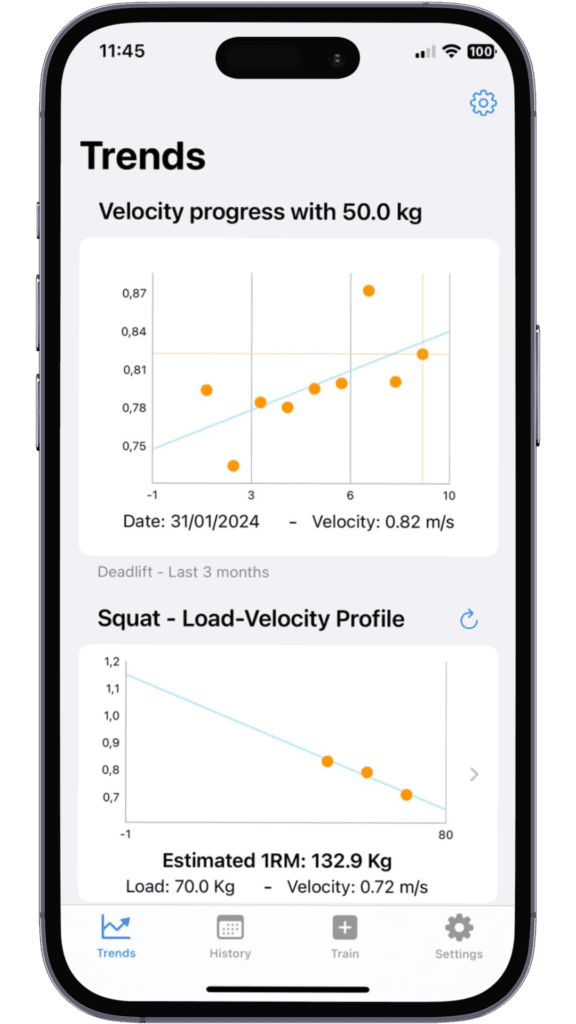
1. Velocity/Power Evolution Graph for a Given Load
This graph shows how your velocity or power for the best rep with a given load has changed over time.
- X-Axis: Represents time or training sessions.
- Y-Axis: Represents velocity (in m/s) or power (in watts), depending on the selected metric.
If the graph shows an upward slope, it means you’re improving, lifting the same load faster or with more power. A downward slope could indicate fatigue or the need to adjust your training program.
2. Load-Velocity Profile
This graph shows how velocity decreases as load increases. Spleeft uses this data to estimate your 1RM and other metrics related to maximal strength and maximal velocity.
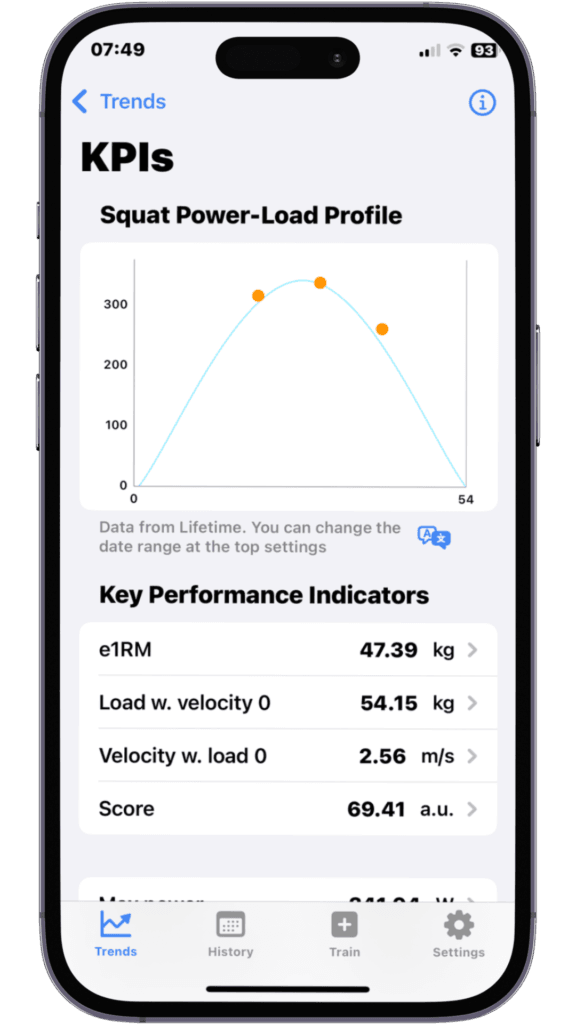
3. Power-Load Profile
The power-load graph shows the relationship between the load lifted and the power generated. This graph typically forms a bell curve, where maximum power is achieved with a moderate load, not too light and not too heavy.
- X-Axis: Load (kg).
- Y-Axis: Power (watts).
The peak of the curve indicates the load at which you generate the most power. This helps you determine the optimal load for training power.
4. Z-Score Graph
The Z-Score graph compares your current performance to your historical bests. It helps you understand if you’re performing above or below your typical standard for a specific exercise and load.
- Green bar: Indicates that your performance is within the normal range (Z-Score between -1 and 1).
- Yellow bar: Slightly below average performance (Z-Score between -1 and -2).
- Red bar: Significantly below average, indicating fatigue or poor performance (Z-Score lower than -2).
- Dark green bar: Exceptional performance (Z-Score above 1).
What is the Z-Score in Spleeft?
The Z-Score in Spleeft is a statistical metric that allows you to compare your current performance to your historical best or average performance for a specific exercise and load. It helps to provide context to your workout by indicating whether you are performing better, worse, or at your normal level compared to past sessions. The Z-Score is particularly useful for tracking fatigue and readiness, as it gives you an objective measure of how your body is responding to training on a given day.
Formula for Z-Score:

Where:
- Best rep velocity today is the fastest velocity recorded during your current workout.
- Historical average velocity is the average of your best rep velocities from previous sessions with the same load and exercise.
- Historical standard deviation is a measure of how much your previous performances have varied.
How to Interpret the Z-Score:
- Z-Score less than -2: This indicates that your performance is significantly below your usual level. If you consistently see Z-Scores in this range, it might be a sign of fatigue, overtraining, or insufficient recovery.
- Z-Score between -1 and -2: A slightly lower-than-normal performance. This could suggest that you are somewhat fatigued but still able to perform reasonably well.
- Z-Score between -1 and 1: This range represents normal performance, meaning that today’s performance is similar to your past average. You are in a stable training state.
- Z-Score greater than 1: You are performing above average, which could indicate good recovery, peak readiness, or improvement in your overall fitness.
- Z-Score greater than 2: Exceptional performance, well above your historical average.
Using the Z-Score allows you to autoregulate your training. If your score is low, you might decide to reduce the intensity or volume of your workout, while a high score could motivate you to push harder, knowing your body is in an optimal state.
How to Configure Metrics in Spleeft
Customizing the metrics you track in Spleeft is essential for tailoring the app to your specific training goals. Whether you’re focusing on velocity, power, or fatigue, Spleeft allows you to configure the app to prioritize the data that matters most to you.
1. Access the Trends Tab
Once you open Spleeft, navigate to the Trends tab, which gives you an overview of your performance across multiple sessions. This tab is where you can configure the metrics that will be displayed.
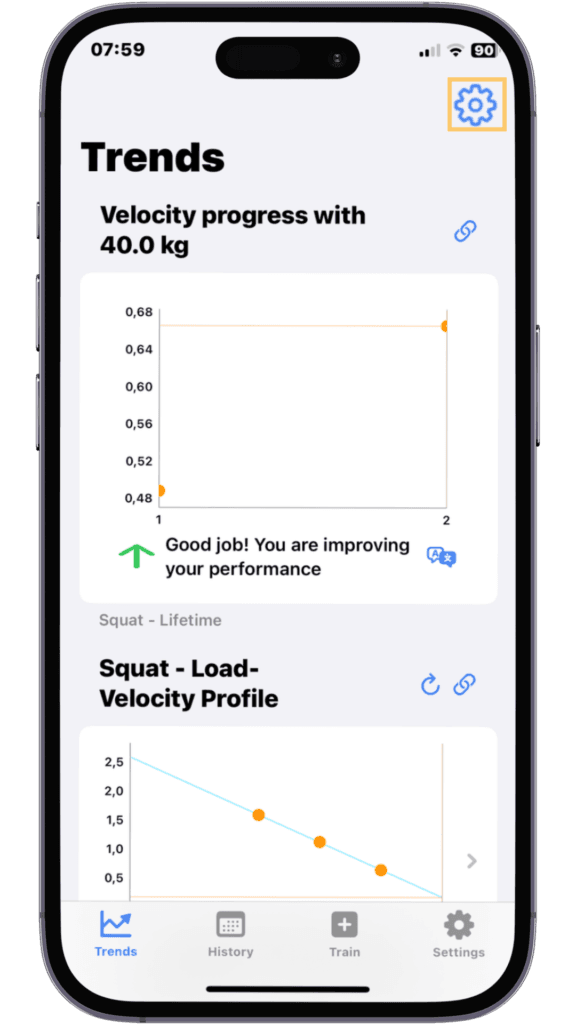
2. Open the Metrics Settings
In the Trends tab, click on the settings icon (typically found in the upper right corner). This will take you to the metrics configuration menu, where you can adjust various aspects of your performance tracking.

3. Select Your Primary Metric
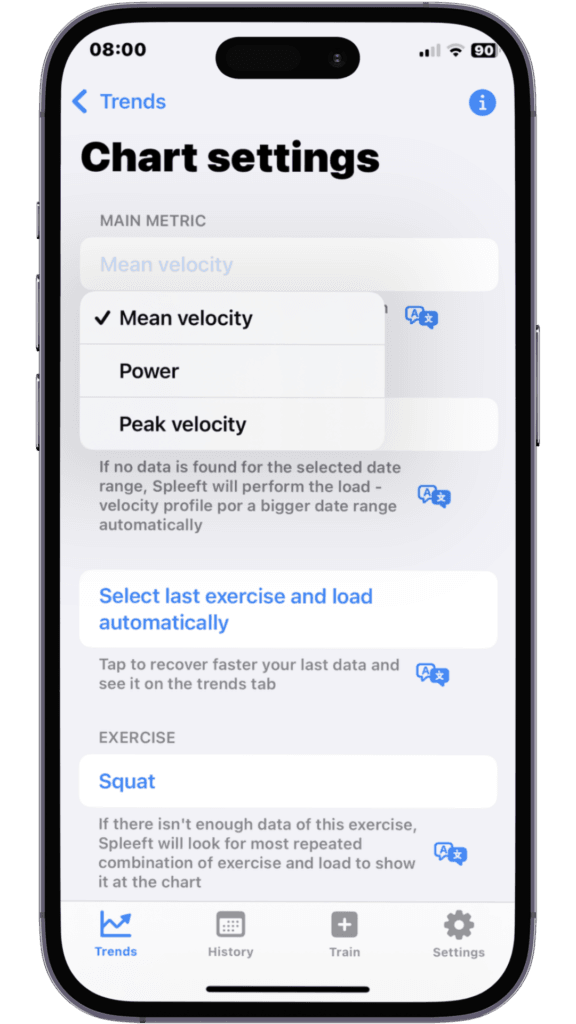
The primary metric is the data you want to focus on the most. Spleeft offers several options for this:
- Average velocity: This gives you the average speed at which you performed your repetitions during a set.
- Peak velocity: Tracks the fastest repetition during your set, giving you insight into your maximal performance.
- Power output: Shows the total power generated during your lifts, which is especially useful for power-focused athletes.
4. Choose Your Date Range
You can select the date range for which you want to see data. Spleeft allows you to choose from predefined time periods (such as the last week, month, or year) or create a custom date range to focus on specific training blocks.
5. Select the Exercise
Next, choose the specific exercise you want to analyze. You can filter the data by the exercises you have performed and the corresponding loads, making it easier to track improvements in a particular movement (e.g., squats, deadlifts, bench press).

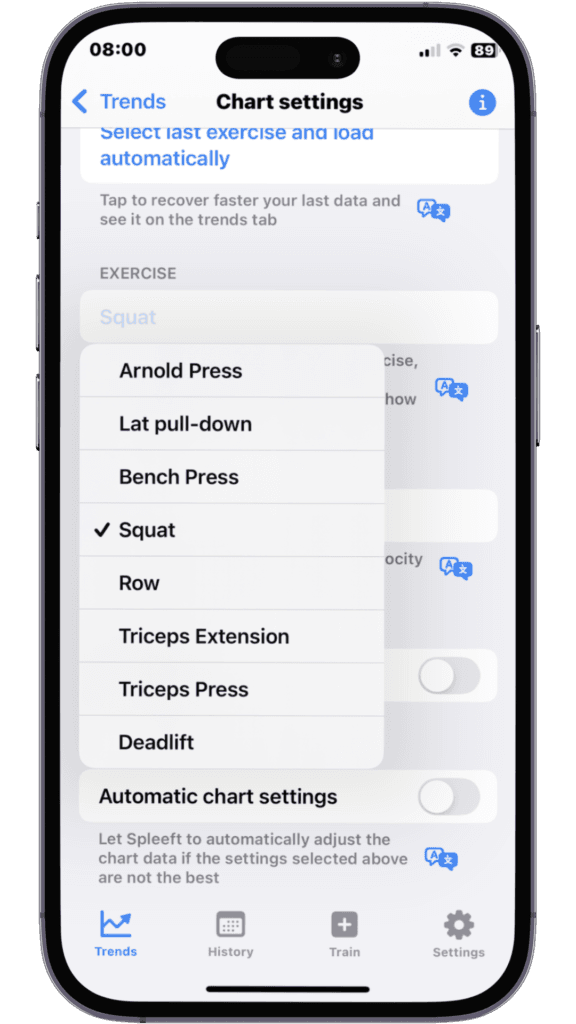
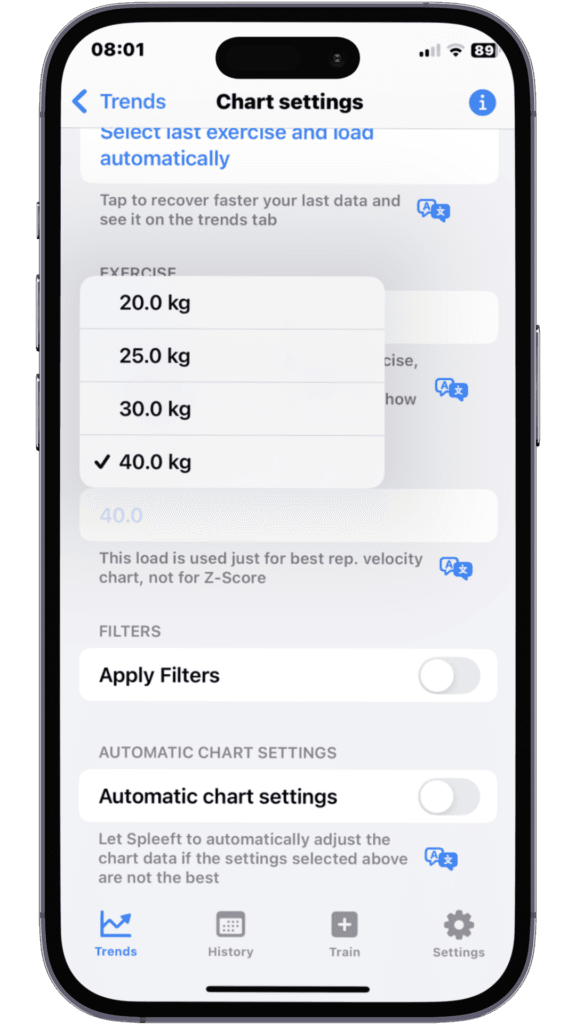
6. Choose the Load
After selecting the exercise, you can narrow down the data further by selecting the load (weight) used. Spleeft will only display the loads you have previously worked with for the selected exercise. This helps you track your velocity or power output at specific weight levels.
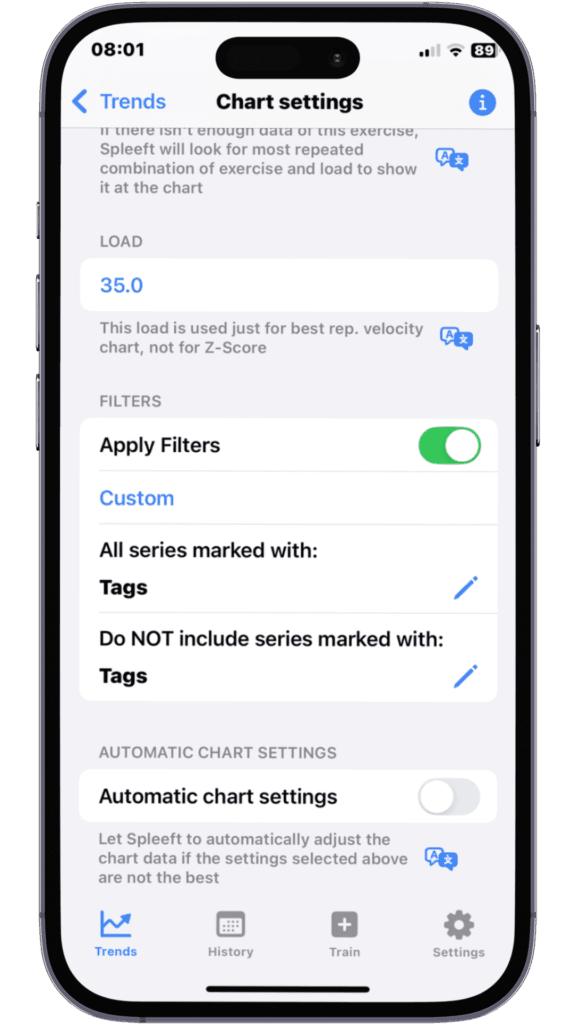
7. Apply Filters
From this option you can select to show or exclude any of your created filters and view the filtered data in trends.
8. Automatic Adjustments
If you prefer not to manually configure these settings every time, you can enable automatic adjustments. This feature allows Spleeft to automatically select the most relevant data to display, depending on your recent workout history and performance trends.
9. Visualizing Your Metrics
Once you’ve configured the metrics, Spleeft will generate easy-to-read graphs showing your performance trends over time. This could include your velocity with a specific load, your power output, or how your Z-Score has fluctuated. This visualization is key to making informed decisions about your training program.
How to Sync Spleeft with Apple Watch
Syncing your Spleeft app with an Apple Watch allows you to track your velocity based training effortlessly during your workouts. With the Apple Watch, you can receive real-time feedback on your velocity, fatigue, and overall performance without needing to hold your phone.
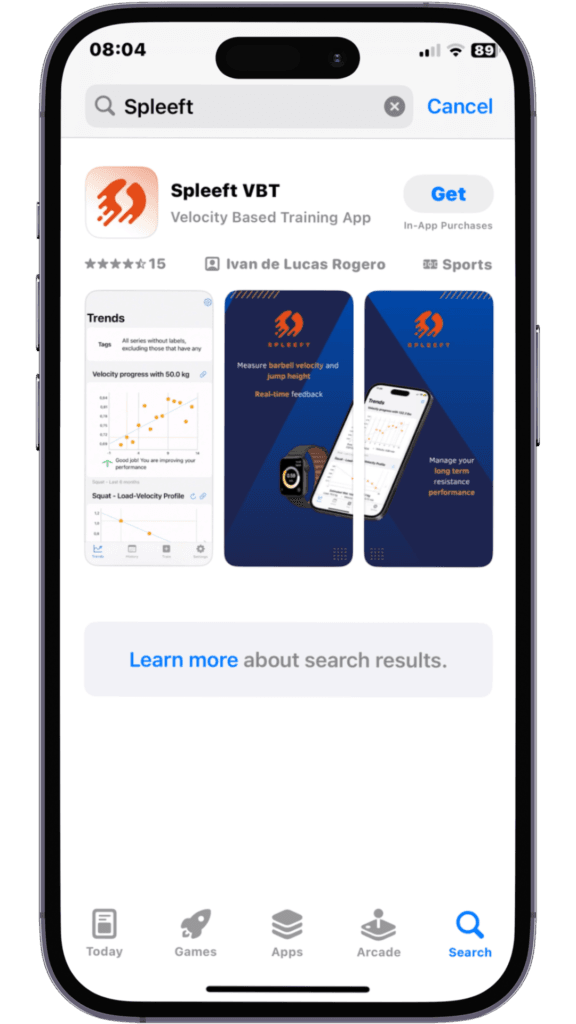
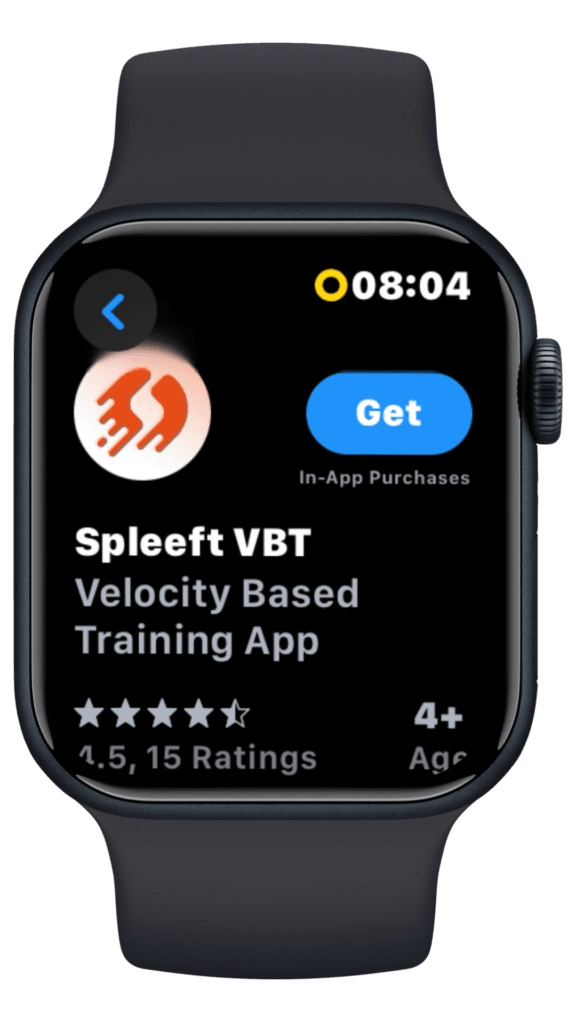
1. Install the App on Both Devices
Ensure that you have the Spleeft app installed on both your iPhone and Apple Watch. If you haven’t already installed it on your watch, you can do so via the Watch app on your iPhone or directly through the App Store on your Apple Watch.
2. Pair Your Apple Watch with Your iPhone
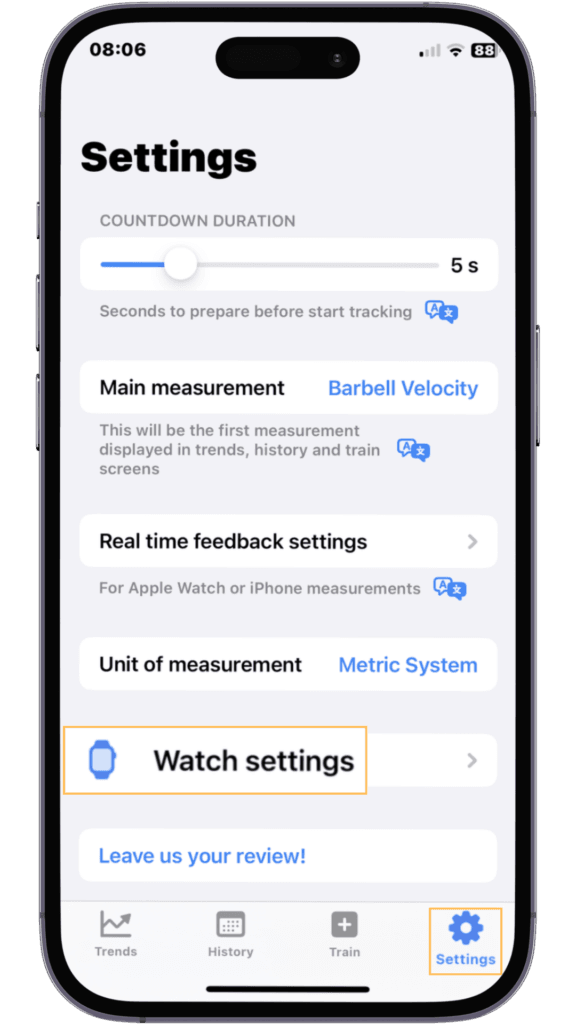
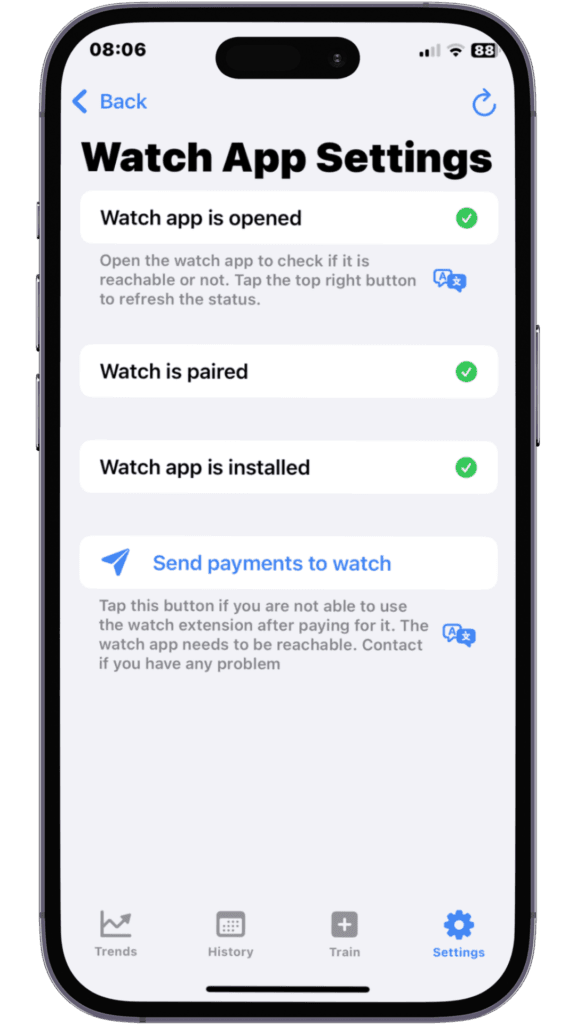
If your Apple Watch is not already paired with your iPhone, you’ll need to do that first. Open the Watch app on your iPhone and follow the instructions to pair the devices. Once paired, they will sync automatically.
3. Enable Permissions
To ensure seamless syncing, open the Spleeft app on your iPhone and ensure that the necessary permissions are granted. The app will need access to the Apple Watch’s sensors (such as the accelerometer and gyroscope) to accurately measure velocity and other metrics.
- You may also need to enable access to HealthKit so that Spleeft can record your workout data, such as velocity and power output, and store it within the Apple Health app for broader tracking.
4. Start a Training Session on Apple Watch
Open the Spleeft app on your Apple Watch. You’ll be prompted to select the type of workout you’re about to perform. You can choose between various options, including strength training or jump training.
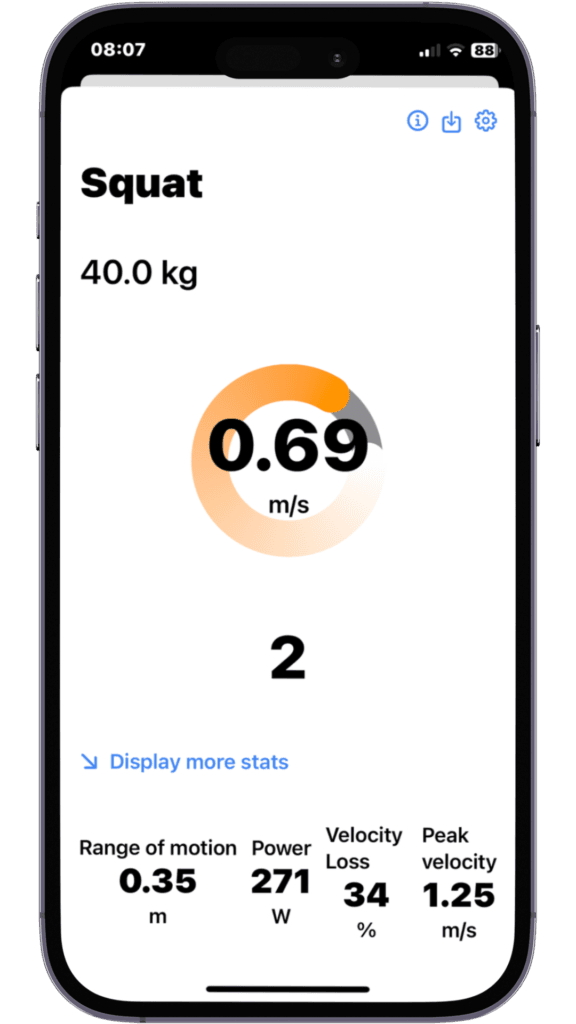
Once the session begins, the Apple Watch will start tracking your velocity and other metrics in real-time. You can monitor your performance directly on the watch screen, without needing to look at your phone.
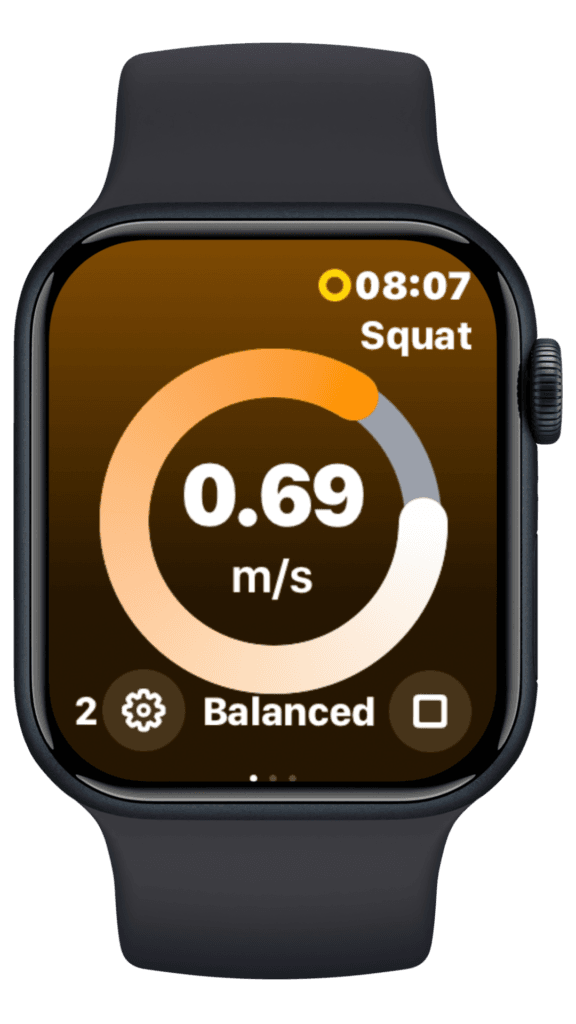
5. Real-Time Feedback
During your workout, Spleeft will display important metrics such as:
- Velocity: The speed at which you’re performing each repetition.
- Fatigue: The app tracks how your velocity declines across reps to measure fatigue.
- Velocity loss: Real-time updates on how much velocity has dropped from your best rep, alerting you when you should adjust the load or stop the set.
You can also set up audio feedback, allowing you to hear updates about your performance, which is useful if you don’t want to look at the screen mid-exercise.
6. End the Training Session and Sync Data
Once you finish your workout, press Stop on your Apple Watch. The data will automatically sync with the Spleeft app on your iPhone, allowing you to review the details of your session, including velocity trends, power output, and any Z-Scores.
7. Review Data on Your iPhone
After syncing, you’ll be able to access detailed analytics of your session directly on your iPhone. The app will display graphs and metrics that give you a comprehensive view of your performance, helping you track improvements over time and adjust your training program accordingly.
Conclusion
Spleeft is a powerful tool for athletes and strength trainers who want to optimize their performance using velocity based training. Whether you’re measuring the velocity of your lifts, calculating your jump height, estimating your 1RM, or tracking progress through Z-Scores, Spleeft makes it easy to gather and interpret data in real-time.
By following this guide, you can configure Spleeft to suit your specific training needs, syncing it with your Apple Watch for added convenience and mobility during workouts. This allows you to make data-driven decisions that can improve your strength, power, and overall performance over time.


