In questo articolo, condivido – da una prospettiva tecnica e riflessiva – il processo di apprendimento e sviluppo alla base dell'ultima ottimizzazione dell'algoritmo Spleeft. Spiegherò come funziona il sistema originale, sviluppato quattro anni fa, e come, nel corso dell'ultimo mese, ne ho perfezionato i parametri per migliorarne sia l'accuratezza che la velocità di elaborazione.
SCARICA ORA L'APP SPLEEFT PER iOS, ANDROID E APPLE WATCH!
Come funziona l'algoritmo?
L'algoritmo Spleeft misura la velocità verticale integrando i dati di accelerazione. La fase concentrica viene rilevata utilizzando soglie di velocità minima per contrassegnare l'inizio e la fine di una ripetizione, ed è richiesta una velocità di picco minima di 0,3 m/s per convalidare il movimento. Questa fase è la più chiaramente definita e prevedibile, il che consente regole di rilevamento più precise.
Per rilevare le fasi stazionarie, essenziali per correggere la deriva accumulata dall'integrazione, utilizzo i dati provenienti da sensori inerziali: accelerometro, giroscopio e sensore gravitazionale. Una fase è considerata stazionaria quando i valori di questi sensori rimangono al di sotto di determinate soglie per un intervallo di tempo specifico.
Questo approccio metodologico coincide con quello utilizzato successivamente da Achermann e altri. nel loro studio di validazione dell'Apple Watch per la misurazione della velocità del bilanciere.
Contesto e contesto tecnologico
In letteratura scientifica, gli accelerometri sono stati tradizionalmente considerati meno accurati nella misurazione della velocità rispetto ad altre tecnologie. Studi comparativi hanno dimostrato che dispositivi come Beast Sensor o Push Band offrono prestazioni inferiori rispetto ad altre soluzioni.
Tuttavia, gli accelerometri sono di gran lunga i sensori più accessibili, poiché sono integrati in dispositivi di consumo ampiamente utilizzati come smartwatch e dispositivi indossabili. Sebbene la loro affidabilità per parametri come la frequenza cardiaca sia stata messa in discussione, il loro potenziale per democratizzare l'allenamento basato sulla velocità (VBT) è innegabile.
Vale la pena notare che la maggior parte degli studi comparativi valuta sistemi completi (hardware + software), senza distinguere tra questi due componenti. A mio avviso, non è corretto attribuire la scarsa accuratezza esclusivamente all'hardware. Un accelerometro può fornire risultati precisi se abbinato a un software ben ottimizzato, progettato specificamente per il tipo di movimento analizzato. Pertanto, prima di escludere una tecnologia, dobbiamo esplorare a fondo le possibilità algoritmiche che offre.
Esistono già prove sufficienti a supporto dell'utilizzo delle IMU (unità di misura inerziale) per stimare la velocità di sollevamento. Aziende come Enode o Output hanno sviluppato algoritmi proprietari che raggiungono un'elevata precisione. Nel caso dell'Apple Watch, diversi studi ne hanno convalidato l'hardware per questa applicazione, sebbene utilizzassero algoritmi diversi dai miei. Ciò rafforza l'idea che un algoritmo appropriato possa superare i limiti spesso attribuiti al solo hardware.
Limitazioni delle IMU per la misurazione della velocità
Queste limitazioni si presentano in una catena. La prima sfida è identificare il modo migliore per elaborare i dati dei sensori inerziali (accelerometro, giroscopio e magnetometro) per stimare con precisione la velocità verticale di una barra.
Uno dei problemi principali è l'integrazione dell'accelerazione. Quando si integra con il metodo trapezoidale (ampiamente utilizzato per la sua semplicità), si verificano errori sistematici noti come deriva accumularsi nel tempo. Per compensare questo, è necessario identificare momenti noti a velocità nulla, noti come fasi stazionarie, che consentano la correzione della deriva.
Elaborazione del segnale per la stima della velocità verticale
I sensori inerziali forniscono dati su tre assi spaziali. Tuttavia, non è sufficiente utilizzare direttamente la componente verticale dell'accelerometro, poiché questo sensore da solo non può determinare con precisione la direzione della forza misurata. Per risolvere questo problema, utilizzo algoritmi di fusione dei sensori come Kalman, Mahony e Madgwick, che forniscono quaternioni di orientamento per correggere il sistema di riferimento del dispositivo.
Ho elaborato i dati provenienti da Apple Watch e iPhone utilizzando diversi algoritmi di orientamento e li ho confrontati con un sistema di motion capture (STT Systems). Ho selezionato la combinazione che offriva il miglior equilibrio tra accuratezza ed efficienza computazionale sui dispositivi mobili.
Una volta corretto l'orientamento, l'accelerazione viene integrata per ottenere la velocità. Per minimizzare ulteriormente la deriva, ho testato l'uso di un filtro passa-basso, come il Filtro Butterworth, ampiamente utilizzato in biomeccanica.
Aggiornamento velocità zero (ZUPT)
Durante i test, ho scoperto che il problema principale non era la correzione dell'orientamento o l'integrazione in sé, ma piuttosto il rilevamento delle fasi stazionarie necessarie per applicare ZUPT. Queste fasi devono essere rilevate in modo rapido e affidabile, poiché la loro accuratezza influisce direttamente sulla precisione del sistema.
Non esiste un metodo univoco per raggiungere questo obiettivo. Pertanto, ho sviluppato un approccio empirico basato sull'analisi sistematica di molteplici combinazioni di parametri: quali sensori utilizzare, quali valori di soglia applicare e quali finestre temporali considerare.

Ottimizzazione degli algoritmi utilizzando la scienza dei dati
Una volta definite tutte le variabili, ho raccolto in laboratorio un ampio set di dati di ripetizioni in palestra, memorizzando i dati grezzi dei sensori. Contemporaneamente, ho utilizzato un sistema di riferimento per il confronto. Gli esercizi selezionati erano: squat con rimbalzo, stacco da terra con pausa (sia concentrico che eccentrico) e lat machine. Tutte le serie sono state eseguite con un impegno elevato per includere diversi livelli di affaticamento e un riposo minimo tra le ripetizioni.
Questa configurazione mi ha permesso di ottimizzare l'algoritmo sia in termini di accuratezza che di velocità, anche in condizioni con poca o nessuna fase stazionaria tra le ripetizioni, lo scenario più impegnativo per i metodi basati sull'integrazione.
Ho creato uno script Python per esplorare sistematicamente 13.486 combinazioni di parametri:
- Se applicare o meno un filtro passa-basso e a quale taglio.
- Parametri ZUPT: soglie, finestre temporali e combinazioni di sensori.
- Soglie di velocità minima per il rilevamento concentrico.
Dopo aver eseguito l'intero set di dati (un'operazione che ha richiesto diverse ore), ho analizzato separatamente le combinazioni più performanti, in base al tipo di esercizio, all'intervallo di velocità e al tipo di stop. Il mio obiettivo non era solo trovare la configurazione più performante, ma anche comprendere meglio il comportamento del sistema per futuri miglioramenti.

Test sul campo
Durante la validazione pratica, ho scoperto che il principale collo di bottiglia era il ritardo dell'algoritmo nel rilevare la fase stazionaria. Il feedback degli utenti era chiaro: il sistema impiegava troppo tempo per fornire il feedback.
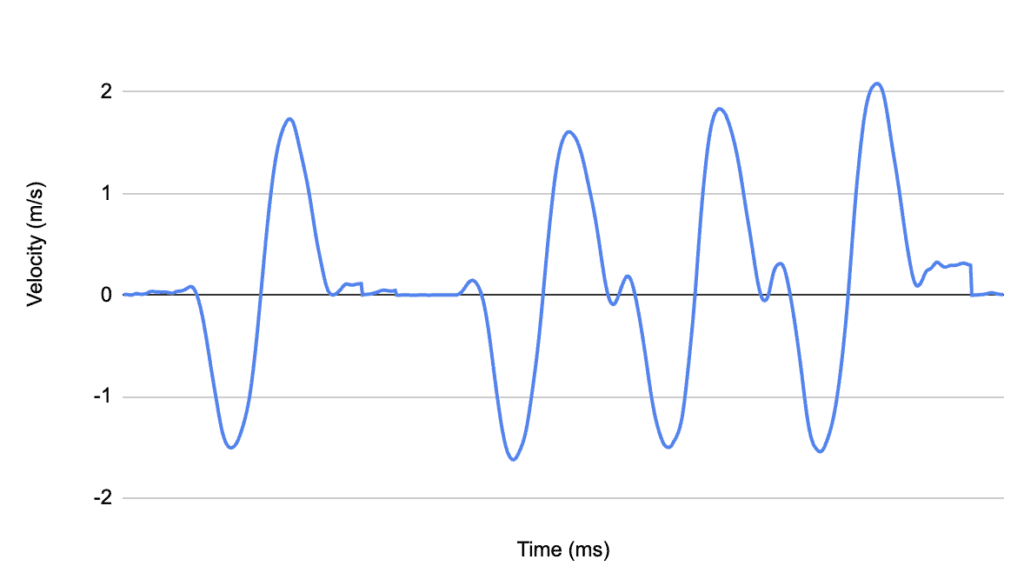
Dopo aver esaminato molti grafici velocità-tempo, ho notato che nel prima ripetizione, non c'era quasi nessuna deriva, anche senza applicare ZUPT. Questo perché la deriva aumenta nel tempo. Mi sono chiesto: la deriva accumulata è abbastanza grande da influenzare significativamente la stima della velocità media?

Per rispondere a questa domanda, ho testato gli squat con una fase eccentrica sostanziale prima di quella concentrica. Ho atteso una prima fase stazionaria per calibrare il sistema, quindi ho eseguito ripetizioni consecutive senza pause. Il risultato è stato sorprendente: l'errore medio è stato di appena 0,018 m/s, e anche più in basso (0,016 m/s) nell'ultima validazione. La differenza rispetto al valore corretto è stata minima, ma il tempo di risposta è migliorato notevolmente, da 800 ms a 200 ms. Ciò ha consentito di fornire feedback subito dopo la fase concentrica, anziché secondi dopo.
Tuttavia, l'algoritmo ZUPT rimane attivo. Quando viene rilevata una nuova fase stazionaria, il segnale viene ricalibrato e qualsiasi errore accumulato viene corretto. Se si verifica più di una ripetizione tra le fasi stazionarie, i valori corretti sovrascrivono il feedback iniziale per garantire che l'utente riceva sempre il risultato più accurato.
Conclusione
Questo progetto basato sui dati mi ha permesso di ottimizzare significativamente l'algoritmo Spleeft. Ho ridotto con successo il tempo di risposta per la stima della velocità media senza compromettere l'affidabilità confermata nelle precedenti validazioni. La chiave è stata combinare la raccolta sistematica dei dati con un'analisi approfondita dei parametri, comprendendo che la qualità del risultato finale dipende non solo dall'hardware, ma forse ancora di più dal software che lo supporta.
Iván de Lucas Rogero
Prestazioni fisiche MSC e CEO SpleeftApp
Dedicato al miglioramento delle prestazioni atletiche e dell'allenamento ciclistico, unendo scienza e tecnologia per ottenere risultati.


